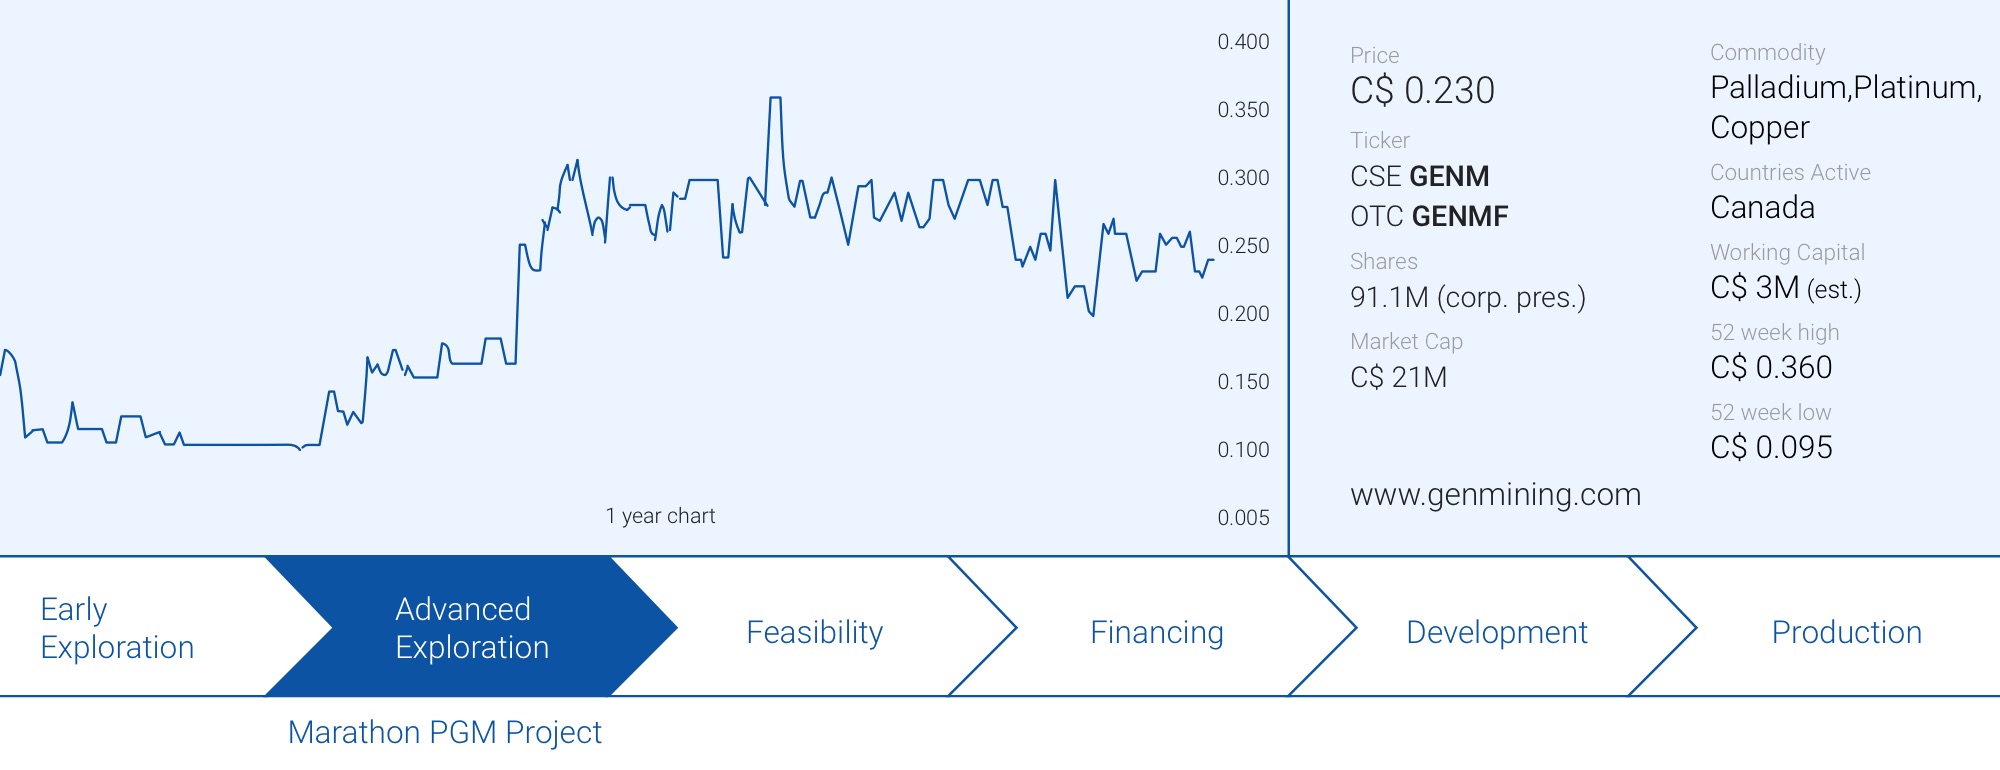
Perhaps it’s because its primary listing is on the CSE instead of on one of the larger exchanges, but it feels like Generation Mining (GENM.C) doesn’t receive the attention it deserves. Not only did the company publish an updated resource estimate which effectively has put it on the map as one of the largest and most promising PGM projects within Tier-1 mining jurisdictions, the palladium price has recently gone through the roof. North American Palladium (PDL.TO) is currently being acquired at a lowball valuation, the physical palladium markets are on fire, but Generation Mining remains in its trading range between C$0.20 and C$0.30.
A frustrating experience so we tried to figure out what we were missing. The updated resource looks good and the company appears to be confident in its recovery and payability percentages. Using all these available elements enables us to put our own DCF (discounted cash flow model) model together which helps us to at least have some idea of the economics that will be outlined in the upcoming PEA.
The updated resource estimate kicks off a new economic study
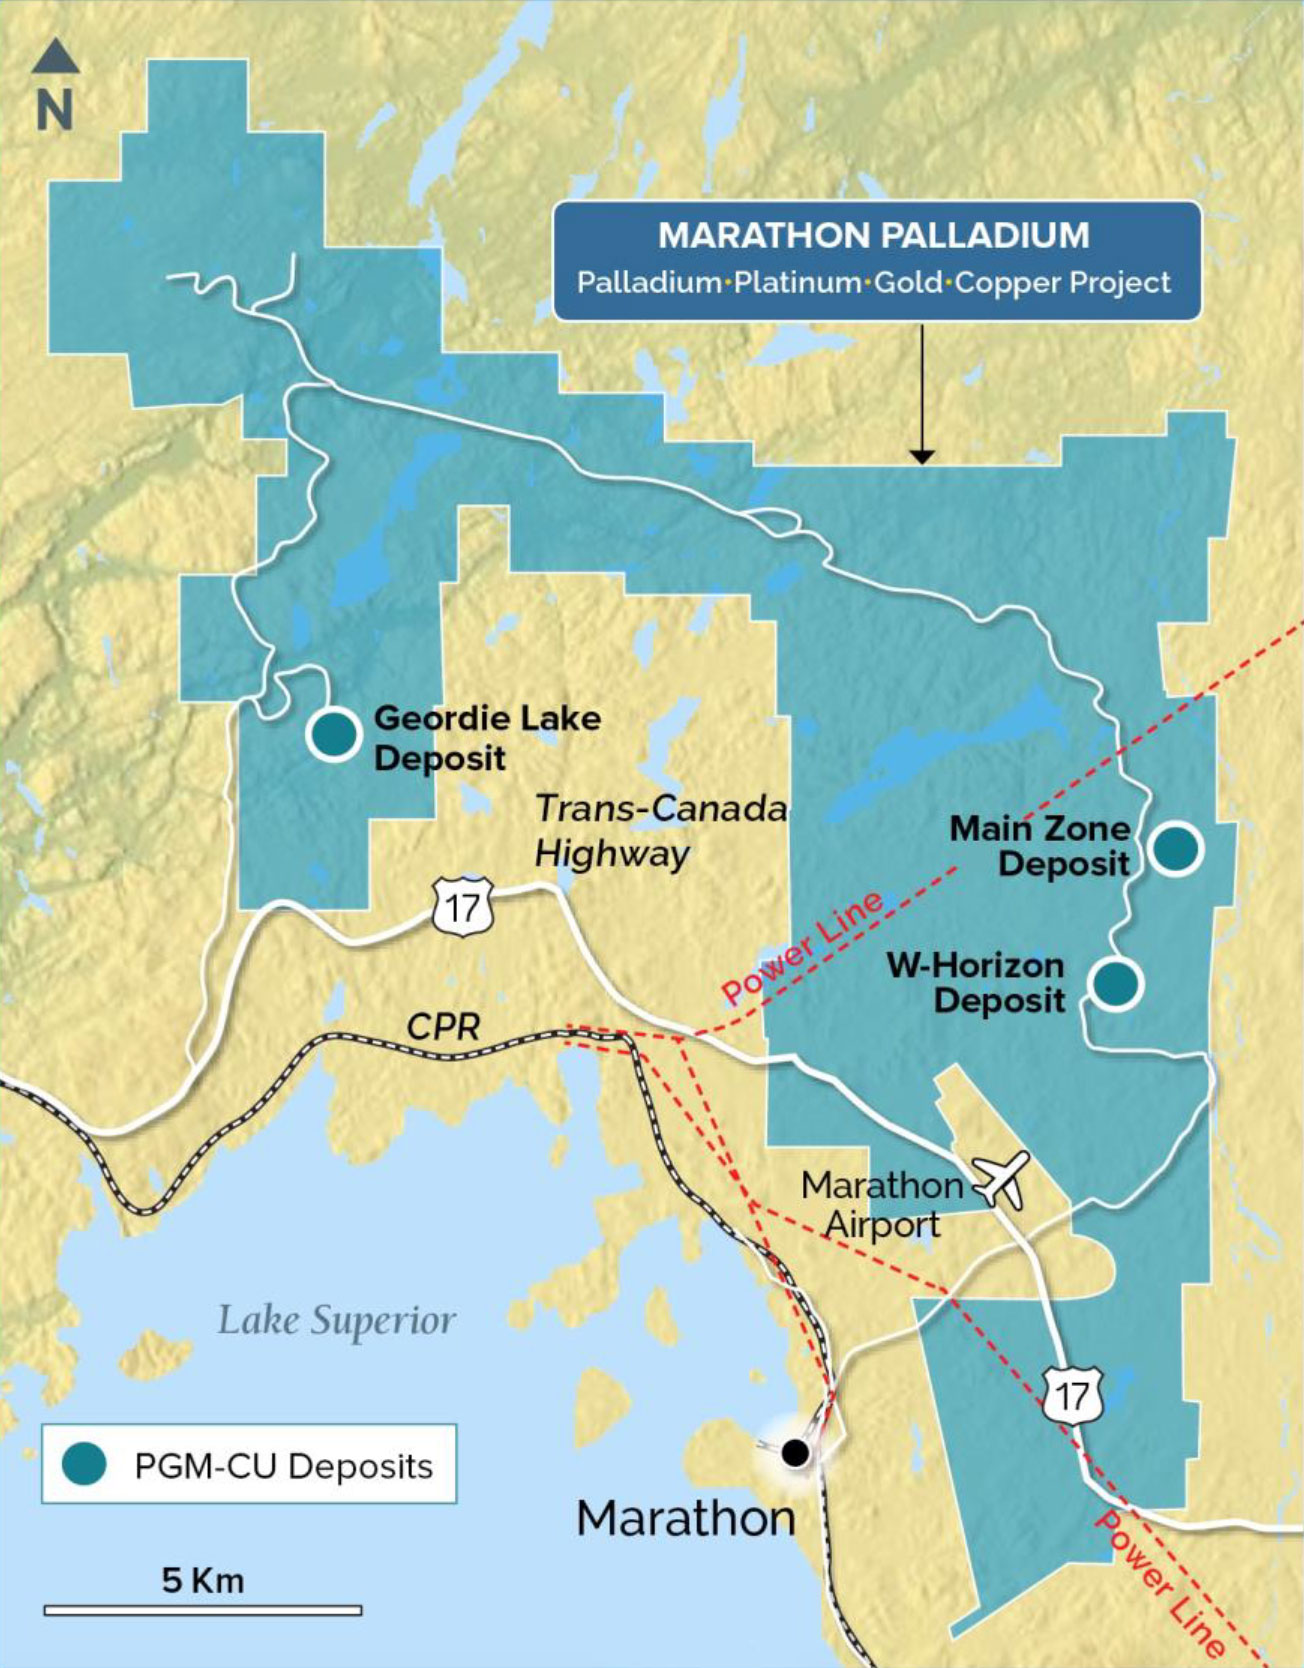
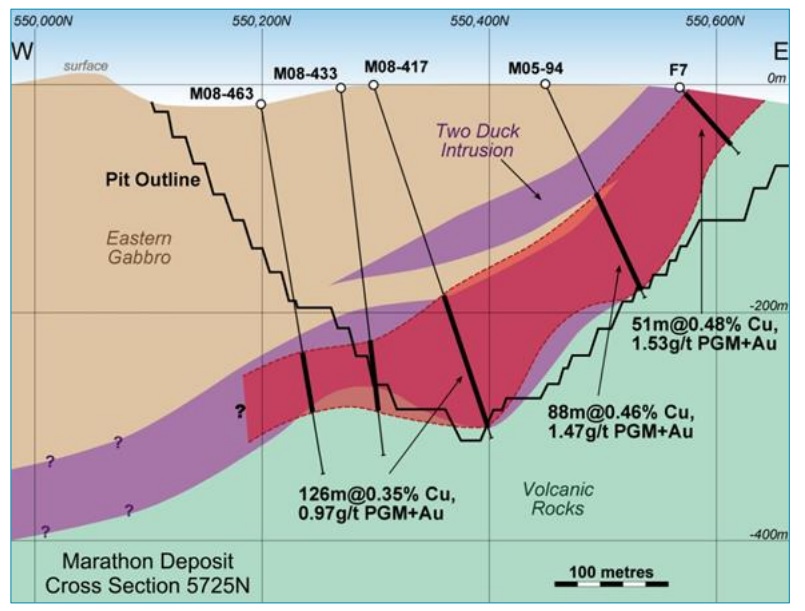
Generation Mining has only completed the purchase of an initial 51% stake in the Marathon PGM project in Ontario for less than a quarter, and the company is already firing on all cylinders with a 12,000 meter drill program in progress and the recent publication of an updated resource estimate using more reliable cutoff grades based on the changed metal price and expected operating expenses environment. The updated resource estimates exclude the Geordie resource, and Generation Mining has now engaged P&E consultants to recalculate the Geordie resource while also providing a maiden resource on the Sally zone, so the recently announced resource estimates will be expanded by several millions of tonnes in the not so distant future.
Generation Mining has provided a resource estimate based on two cutoff grades using a C$13/t rock value and a C$25/t rock value. Obviously the C$13 NSR cutoff value has the best result with a total of 3.24 million ounces of palladium, almost 1.1 million ounces of platinum, 390,000 ounces of gold, 9.3 million ounces of silver and just short of 800 million pounds of copper for a 7.13 million ounce palladium-equivalent resource in the measured and indicated resources. The average rock value of that M&I resource using $1575 Pd, $940 Pt, $1500 gold, $18 silver and $2.61/lb copper is US$48.70/t (the gross value, so excluding recoveries and payabilities – see later).
A good result considering the cutoff grade based on a rock value of C$13/t, but just to err on the cautious side, perhaps it’s safer to use the resource with a higher cutoff grade using C$25/t as cutoff value. That resource is just a bit smaller (5.83Moz PdEq) but the average PdEq grade is more than 20% higher which makes this resource more robust. And after all, even after using the higher cutoff grade, the Marathon project still contains 2.74Moz Palladium, 850,000 ounces platinum, 300,000 ounces gold, 6.3Moz silver and in excess of 600 million pounds of copper.
Running some of the numbers by ourselves
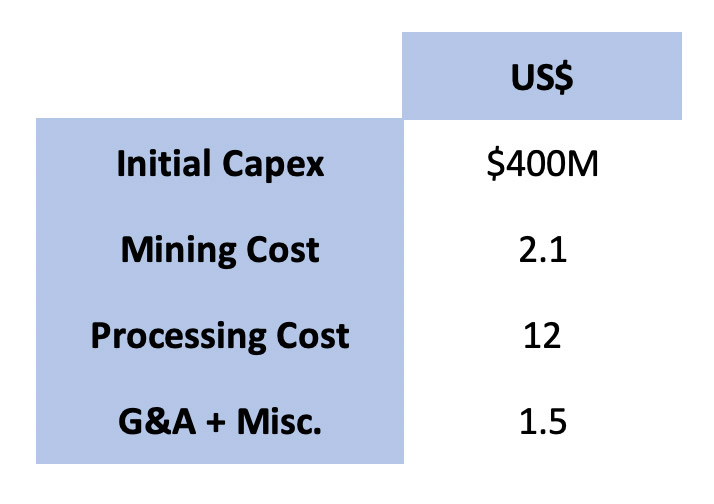
Our life has been made a little bit easier by New Age Metals (NAM.V) which reported the results of a PEA on its PGM project earlier this year. While we don’t agree with some inputs (New Age used a mining cost of C$2/t which is just US$1.5/t which is perhaps a little bit too optimistic), we do think the initial capex of around C$500M seems to be fair.
As all commodities that will be produced by Generation Mining will be sold in US Dollar terms, we preferred to run our numbers in USD. That will make it easier to just apply the applicable USD/CAD exchange rate on the end result to see how the CAD-equivalent of the Net Present Value evolves depending on the exchange rate.
These are the inputs we will be using for a 16,500 tonne per day operating scenario (the operating expenses are per tonne of rock):
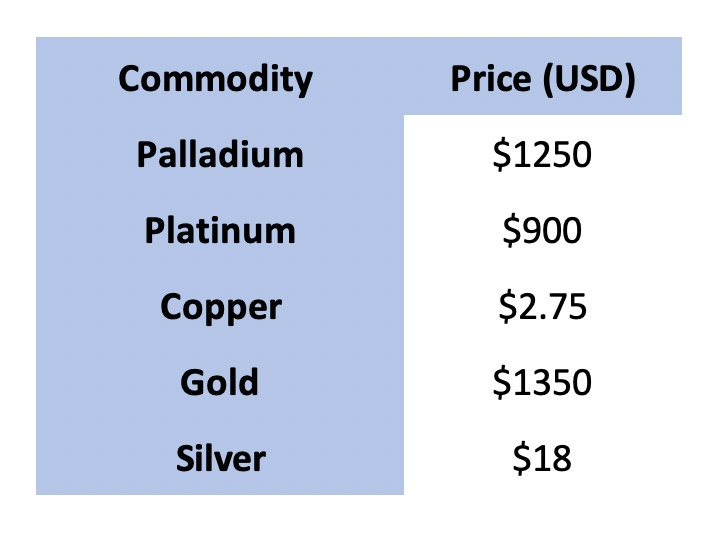
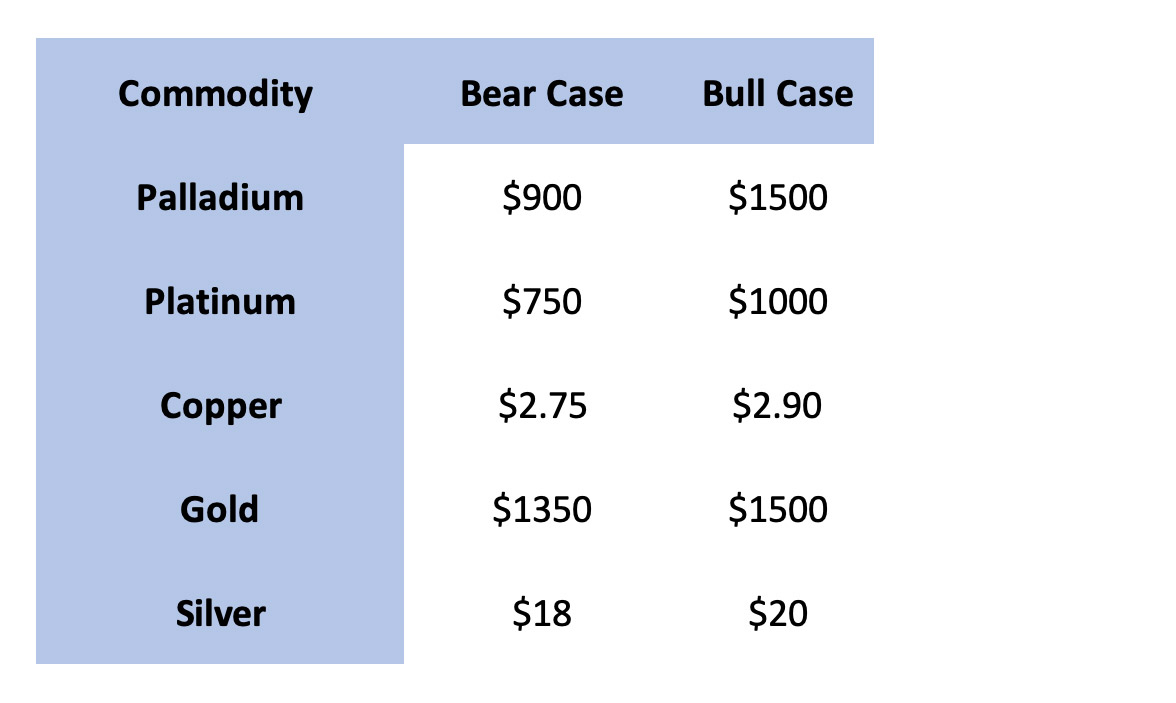
In our base case scenario we will be using these commodity prices:
We will apply a sustaining capex of US$5M per year (which will be expensed on an annual basis) and an accelerated depreciation of the initial capex over 10 years (resulting in a depreciation charge of US$40M per year). As mentioned before we will be using Generation Mining’s updated resource estimate based on a cutoff NSR value of C$25/t as the total resource now contains 116 million tonnes in all resource categories combined, we will assume a 16-year mine life. Using the proposed 16,500 tonne per day operating scenario this means 96 million tonnes will be processed which leaves around 20 million tonnes on the table (in the ground, actually).
We are applying a total tax rate of 35% to the taxable income, but will apply the existing accumulated deficit on the balance sheet in Y1 of the operations. By the time this mine will effectively get going, the accumulated deficit will have increased from the current deficit of C$3.1M. To keep things simple, we will assume the deficit will cover the entire taxable income in Y1, but will apply a normalized tax rate from Y2 on.
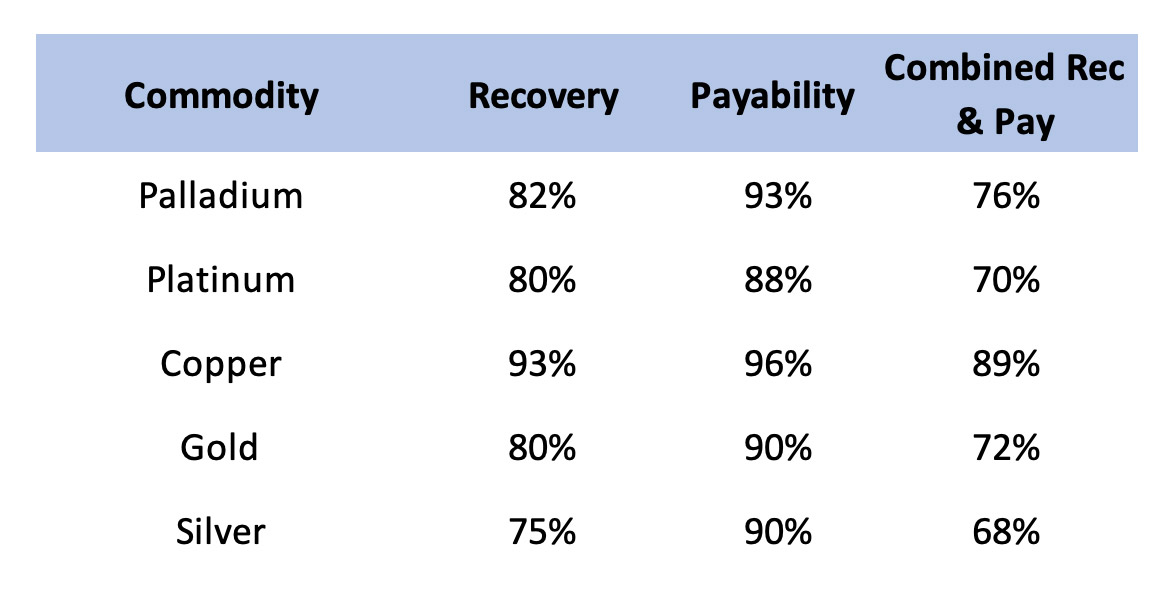
For the recovery rates and assumed payability of the PGM concentrate, we will be using the percentages provided in the updated resource estimate. We have summarized the percentages and cumulative recovery & payability percentage here below.
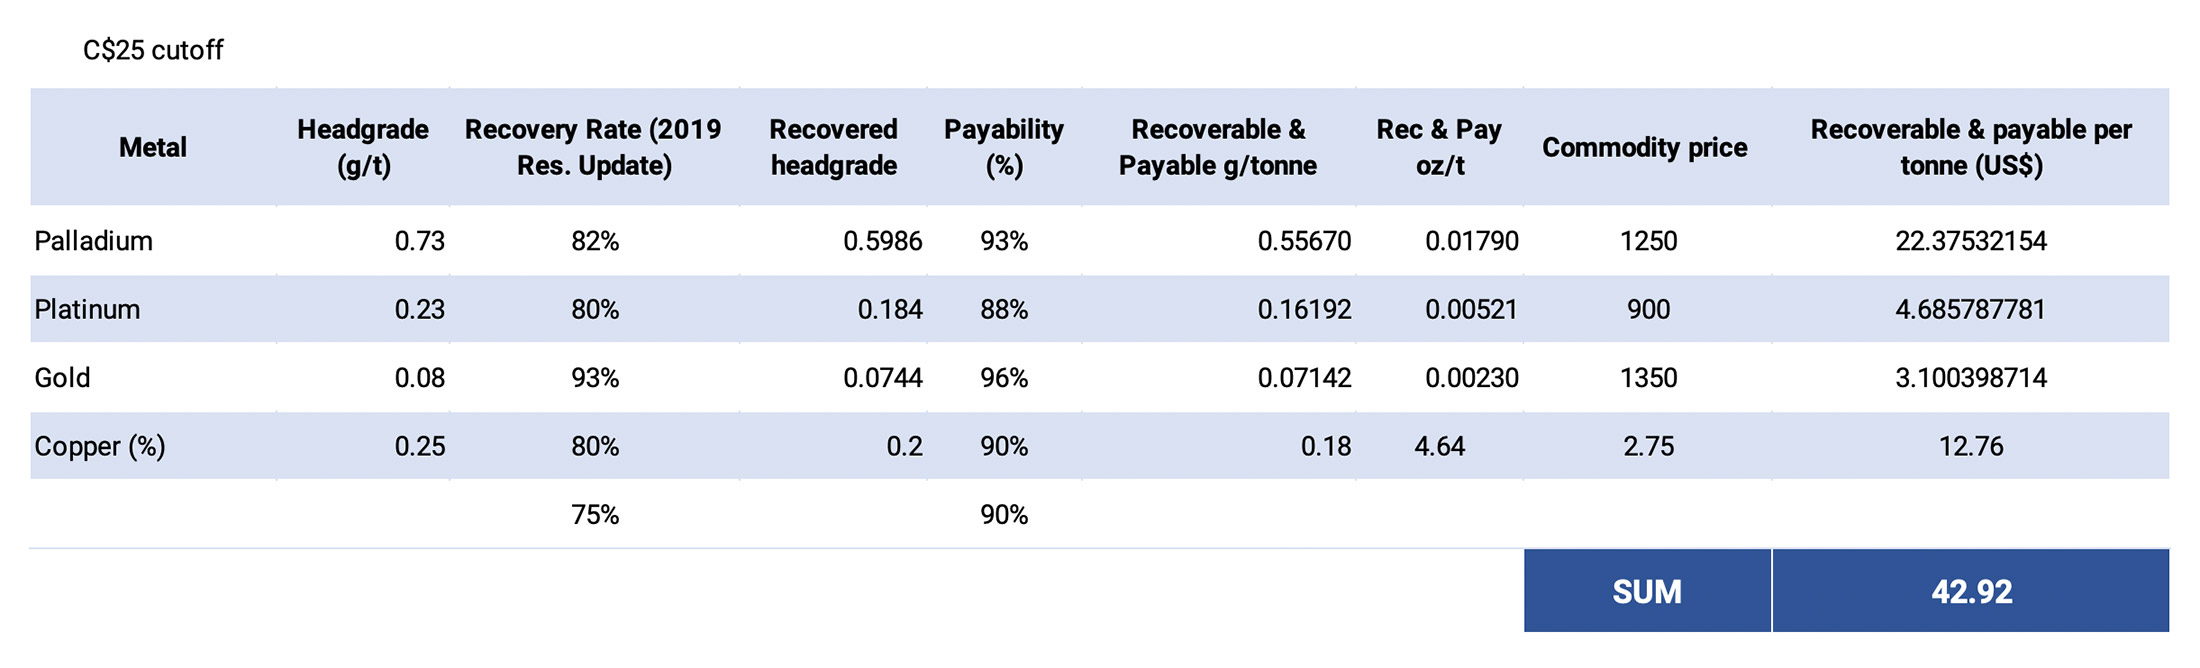
Step 1: determining the net payable revenue per tonne
First of all, considering the silver grade is very low, we will exclude it from the calculations for the time being as it won’t move the needle. The post-recovery and post-payability net revenue per tonne using our base case prices is approximately US$42.92/t.
Step 2: determining the taxable income
A first obvious step is to determine the production cost. We scanned the recent technical report on the resource update, but no strip ratio was mentioned in that report (although it clearly is a pit-constrained resource). We will just use the average strip ratio of 2.88 as calculated in the 2010 feasibility study on the project.
This results in the following operating costs: 3.88 X $2.10 + $12 + $1.50 = US$21.65.
Subsequently, we also need to calculate the sustaining capex/t (which we will expend) and the annual depreciation expenses per tonne of processed rock as this will act as some sort of temporary tax shield. The US$5M/year represents US$0.83/t while the depreciation charges of US$40M/year represent a pro-forma cost per tonne of $6.67. So the first 10 years of the mine life the additional expenses will be US$7.5/t, falling back to just the expensed sustaining capex at US$0.83/t once the initial capex has been fully depreciated from Y 11 on.
The operating expenses are purely based on the currently known resource estimate and mine plan and do not include a budget for additional drilling and don’t take potential interest payments into account.
So in Y1-10 the taxable income per tonne will be US$42.92 – $21.65 – $7.5= $13.77/t. Applying a 35% tax rate means that in Y1-10 the tax per tonne will be $4.82. After deducting the tax but re-adding the depreciation expense (which is a non-cash charge, the net incoming after-tax cash flow is:
$13.77 – $4.82 +$6.67 = $15.62.
In Y11-16 the annual depreciation expense falls away and the net incoming cash flow per year is then $42.92- $22.48 (including the sustaining capex here) X 0.65 = $13.29. That’s lower than in years 1-10 as the tax shield provided by the depreciation expenses disappears.
Step 3: putting everything together in a DCF model.
We will be using a discount rate of 7%. We feel a discount rate of 5% which appears to be standard for gold projects is too optimistic given the predominantly industrial applications for palladium and platinum, but the standard 8% for base metal projects would be a bridge too far. 7% appears to be a fair compromise.
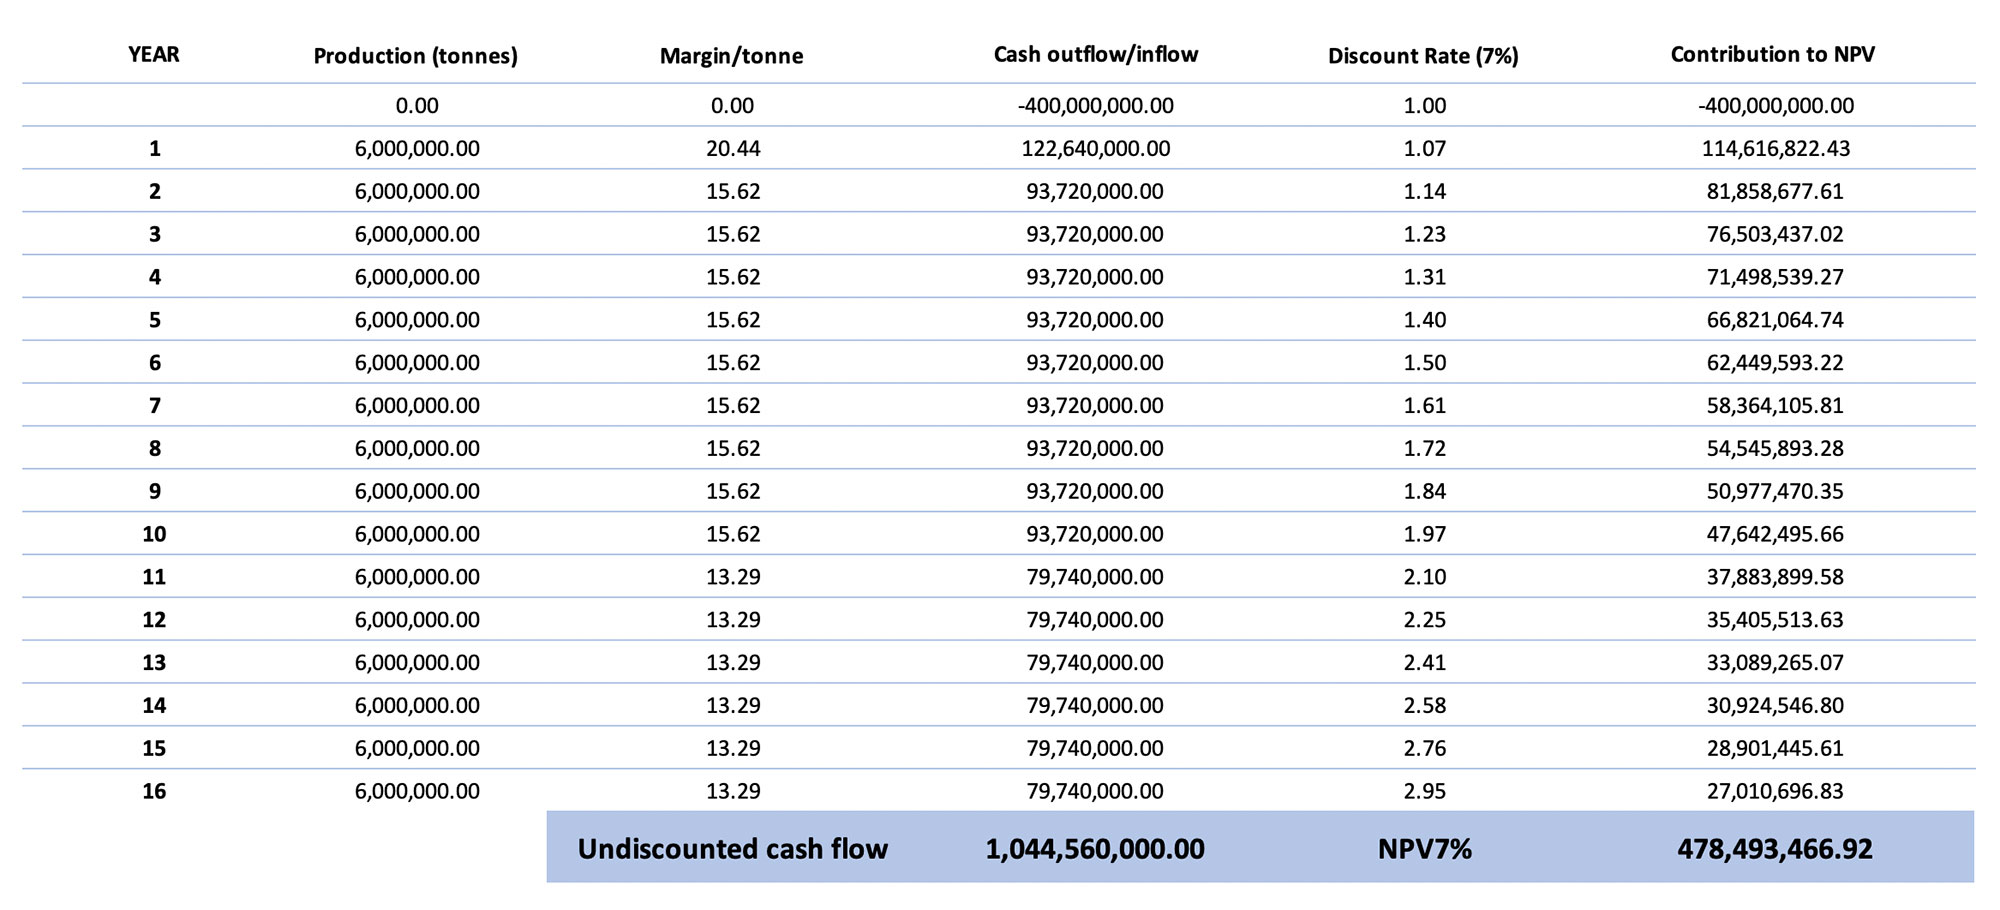
The after-tax NPV7% in the base case scenario would be US$478M (around C$640M). The discount rate plays an important role here as the undiscounted net cash flow exceeds the US$1B mark. If we would apply a 5% discount rate to the DCF model, the after-tax NPV5% would come in at US$600M/C$800M. And keep in mind this is based on a 16-year mine life processing just 96 million of the 116 million tonnes in the resource. Given Generation Mining’s push forward on the exploration front where the company expects to find additional Pd-Pt mineralization, we dare to say that at this point, our base case scenario is quite conservative. In this scenario, the after-tax IRR of 24% is excellent. On a pre-tax basis, the IRR even increases to 30%.
The sensitivity analysis
As the palladium price has been very volatile recently, we also worked out an additional bear case scenario and bull case scenario. And although the current palladium price is north of $1700/oz, we are still assuming a palladium price of just $1500/oz in our bullish scenario. In the bearish scenario we will let the palladium price drop below $1000/oz again. We are maintaining a 16 year mine life in the bearish scenario but are boosting the mine life to 18 years in the bullish scenario as the higher the commodity prices are, the more likely it is the entire (in-pit!) resource could be brought into the mine plan.
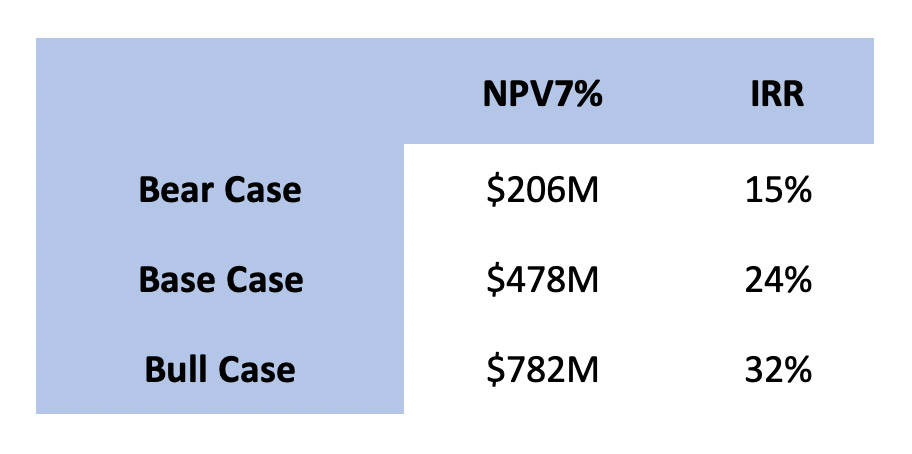
As you can easily rebuild the back of the envelope economic model, we will just summarize the results here below (on an after-tax basis).
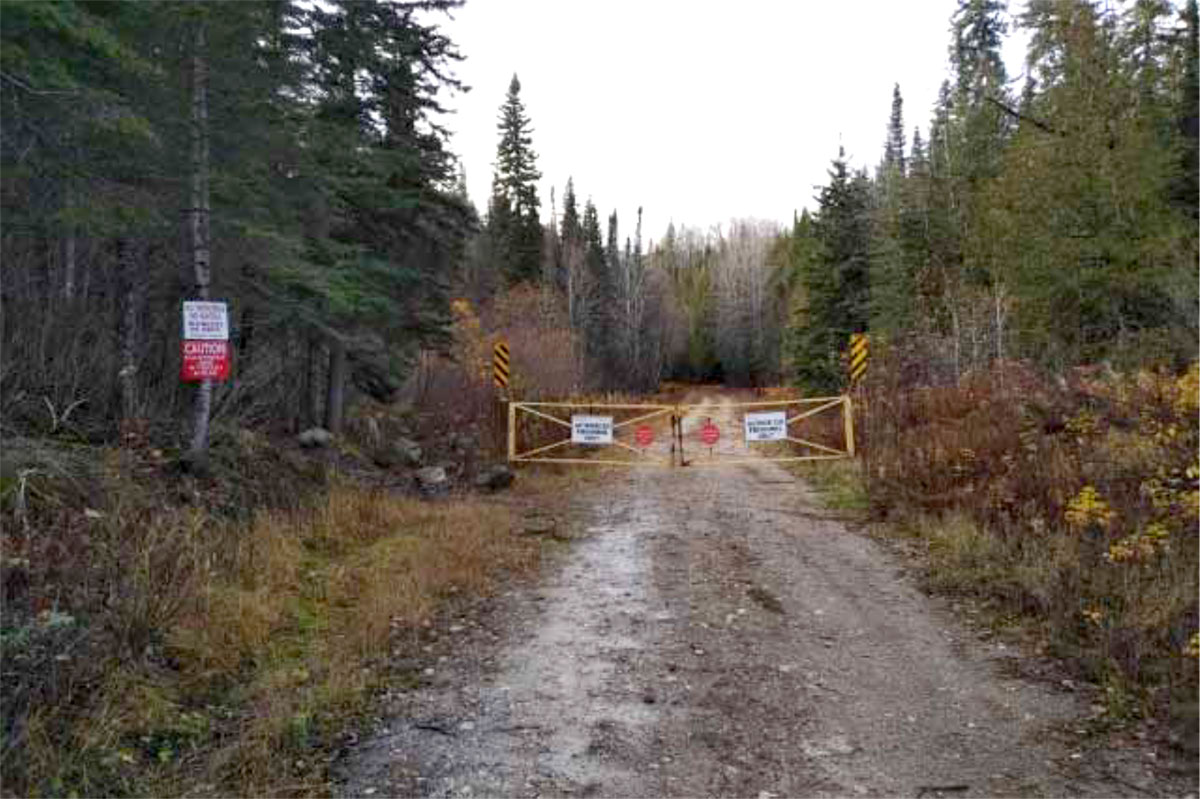
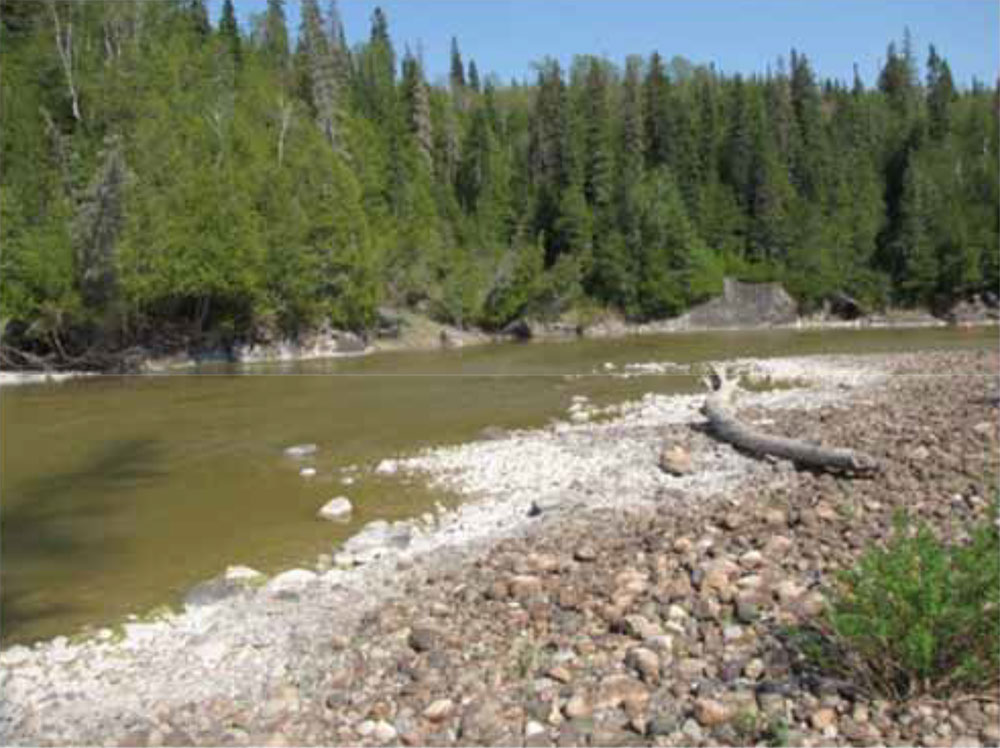
Access Road (left), Pic River Photograph (Right)
A caveat
As you noticed, we used inputs that we think are acceptable and defendable based on similar projects and earth-moving operations in North America. But of course, our calculation remains a ‘back of the envelope’ project and should only be seen as ‘setting some expectations’ for the upcoming PEA. As such, please consider our numbers and calculations as ‘for educational and informational purposes only’ as this obviously does not represent the official expectations of the company. The PEA should be out next month, and we emphasize you should only rely on the official study.
Our model is simplified and just takes the average grades and strip ratios into account. As there are some higher grade areas within the resource it’s perfectly possible for Generation Mining to focus its mine plan on ‘high-grading’ in the first few years of the mine life to accelerate the cash flows and reduce the payback period. As such, the strip ratio will very likely vary compared to the 2.88 we used in the model.
The implication of positive economics on the deal with Sibanye-Stillwater
As you remember, Generation Mining is currently earning an 80% stake in the Marathon PGM project from Sibanye-Stillwater. However, Sibanye does have the right to re-acquire a majority stake in the project, leaving Generation Mining with a 49% direct ownership in the property.
As Generation has already pre-negotiated the exact terms of the potential claw-back provision. Sibany would have to fund 31% of the capex (US$124M in this case) which means Generation Mining will end up owning 49% of the project in return to provide funding of US$135M.
If we would include this potential deal in our estimates (especially the $124M in capex that will be carried by Sibanye), Generation Mining’s remaining 49% stake would have a fair value of US$304M (or roughly C$400M).
Of course, this would be a worst-case scenario and ideally, Generation Mining ends up effectively owning 80% of the Marathon project. Also note the Marathon deposit is completely royalty-free, so should the viability of the project be confirmed, Generation Mining will undoubtedly be able to sell a royalty on the project as part of its equity portion of the funding package.
Conclusion
Numbers rarely lie. And based on the inputs we used to run our NPV model it looks like Generation Mining made quite a coup by securing the option to earn an 80% stake in the Marathon PGM project. Even in the base case scenario (which uses a palladium price 25% lower than the current spot price), the after-tax NPV7% remains very strong.
Looking at these numbers it’ll be tough to imagine Sibanye-Stillwater will NOT exercise its back-in right. On top of that, as long as Generation Mining trades at its current valuation of less than C$21M, the company could be an easily digestible takeover target for a larger company looking to gain exposure to the PGM space. But let’s first wait for the PEA in December to confirm our expectations.
Disclosure: The author holds a long position in Generation Mining. Generation Mining is a sponsor of the website.