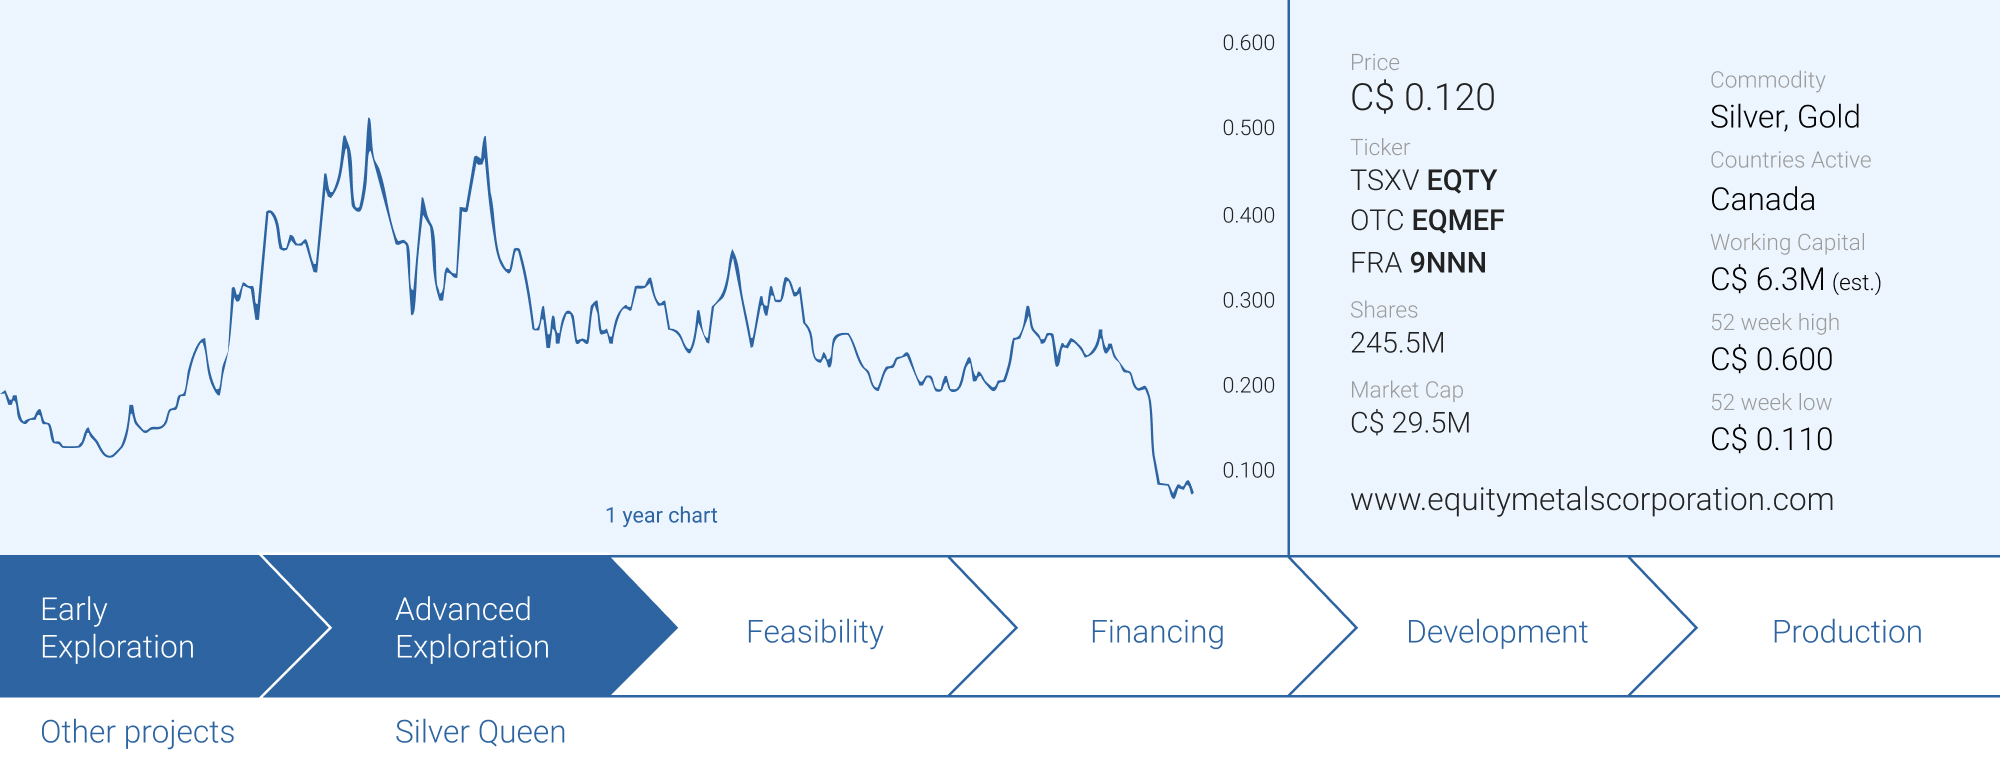
Equity Metals (EQTY.V) has published its long-awaited resource update on the Silver Queen project in British Columbia, but the updated resource fell short of expectations. It also missed our expectations as we were anticipating a triple digit number for the overall silver-equivalent ounces, and we certainly did not anticipate a relatively flat resource update.
Equity Metals did add tonnage to its resource. It even added more ounces of gold, silver and pounds of zinc and lead. But due to the higher silver price, a higher amount of those ounces and pounds is needed to run the silver-equivalent calculation, thereby reducing the silver-equivalent number.
In this update, we’ll discuss the updated resource, how it compares to the 2022 resource, and why/how the new resource limbo’ed under the expectations despite incorporating the data of almost 35,000 meters of extra drilling. And although the size of the resource update is disappointing, we will show how the higher commodity prices provide an important tailwind to the total value of the project as the NSR value of the indicated resource category increased by almost 50% using an updated price deck.
The updated resource versus the 2022 resource
The current resource contains 3.57 million tonnes in the indicated resource category with an average grade of 184 g/t silver, 1.8 g/t gold, 0.3% copper and 4.5% ZnPb for a total silver-equivalent grade of 425 g/t. This results in 48.7 million ounces silver-equivalent, of which 21 million ounces are actual silver.
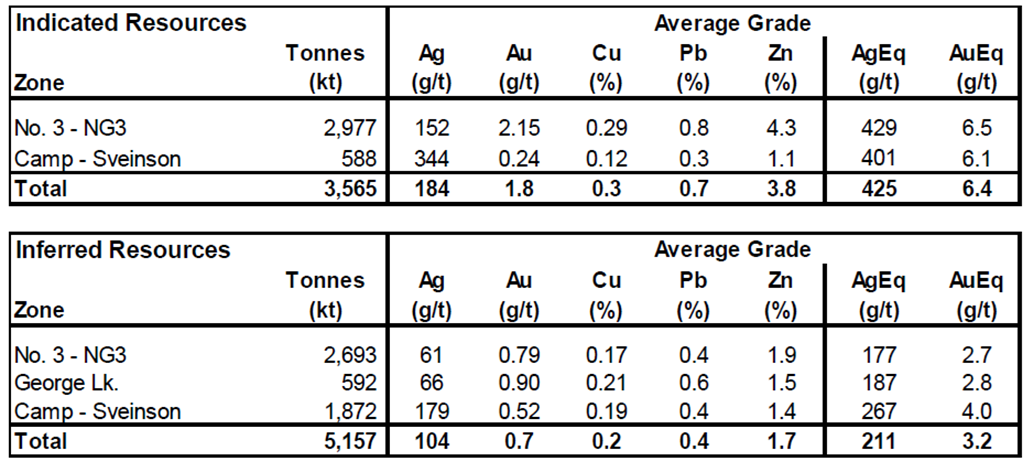
The inferred resource contains 5.16 million tonnes at 104 g/t silver, 0.7 g/t gold, 0.2% copper and 2.1% ZnPb for an average grade of 211 g/t silver-equivalent, containing 35 million silver-equivalent ounces, of which 17.3M ounces are ‘real’ silver. As you notice in the table above, the average grade in the inferred resource is less than half the average grade in the indicated resource due to the stricter application of grade control and dilution added to the resource during the Stope Optimization process used as part of establishing Reasonable Prospects for Eventual Economic Extraction (RPEEE).
The lower grade also has a direct impact on the indicated resource. While the total tonnage remained roughly stable (+3%), the 25% grade reduction in the silver-equivalent grade resulted in a very painful decrease in the silver-equivalent resource although the total amount of silver in the indicated resource actually remained stable. Back in 2022, silver represented approximately 1/3rd of the silver-equivalent ounces in the indicated resource category, but this has now increased to approximately 43% in the 2026 resource calculation.
The current resource calculation thus contains almost 50 million ounces silver-equivalent in the indicated resource category and an additional 35 million ounces silver-equivalent in the inferred resource category.
We know the cutoff grade of the resource was based on a C$122/t NSR cut-off. But as we also have the recovery rates for the respective metals, we are able to calculate the net rock value per tonne (this includes the impact of the recovery rates, but excludes the payability percentage for the respective concentrates and referred to as NSR). Note: we are using a higher silver and gold price than the prices used in the NSR calculation as this is just a back-of-the-envelope exercise to help putting numbers into perspective.
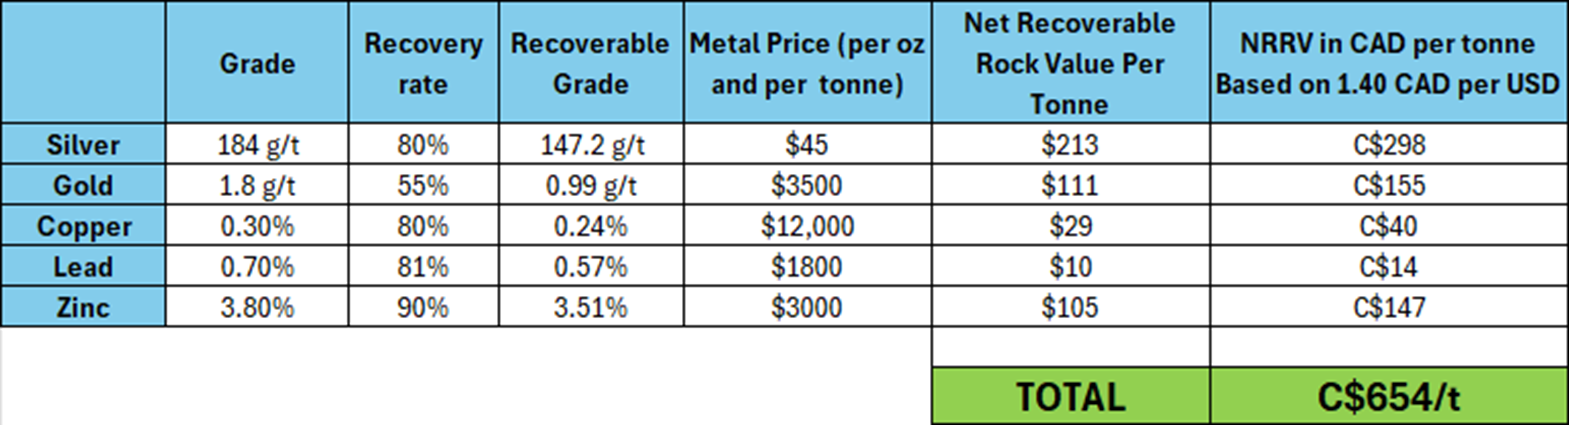
Again, this does not take payability percentages into account. But even if you’d be harsh and apply an 80% payability percentage on all metals, the net recoverable and payable value would still exceed C$500/t, providing a 75% margin if the C$122 NSR value is deemed to be realistic and reliable.
And to put this more into perspective: using the aforementioned C$500 in net recoverable and payable rock value per tonne and deducting C$122/t in anticipated operating expenses, the indicated resources would have a value of 3.5M tonnes * C$378 = C$1.3B as a pro forma sum of the net cash flows (undiscounted and pre-tax).
Readers are warned the calculations are just for illustration purposes and are to be interpreted as a tool to help understand grades and the impact of recovery rates.
What does the table above look like when applying this to the lower-grade inferred resource? It goes without saying the net recoverable rock value per tonne will decrease as well, but by how much? We run the numbers again, using the average grades of the inferred resource category.
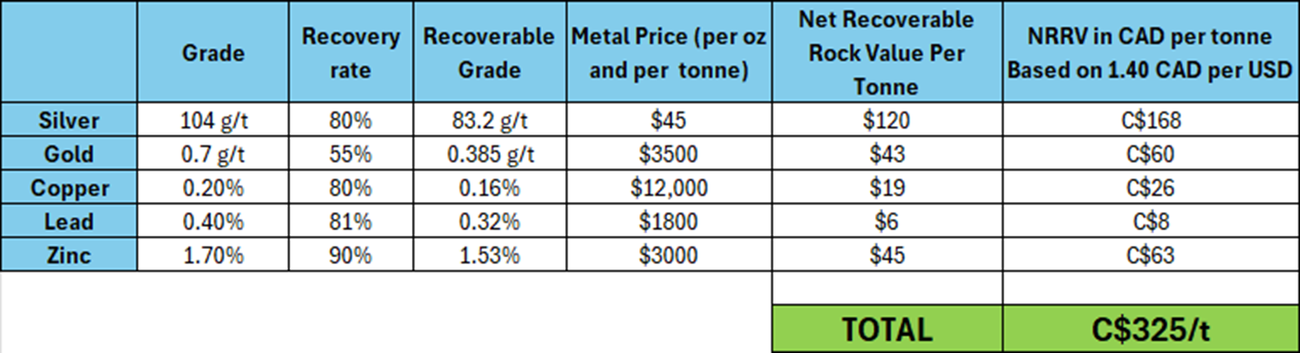
While clearly not as impressive, the margins versus the C$122 NSR based cutoff grade remain strong. Applying a similar average payability of 80% would result in a net margin of C$138/t for an additional C$700M in undiscounted pre-tax NSR value. That NSR value remains sensitive to price changes: applying a $55 silver price would add an additional C$400M in NSR value across both resource categories.
Again, these are just rudimentary calculations and the effective net recoverable value per tonne of rock can only be calculated once payabilities are known. And that’s why it’s perhaps a good idea to move this project forward towards a PEA as that will allow the company to complete more detailed work on the economics.
Let’s now compare this to the 2022 resource calculation.
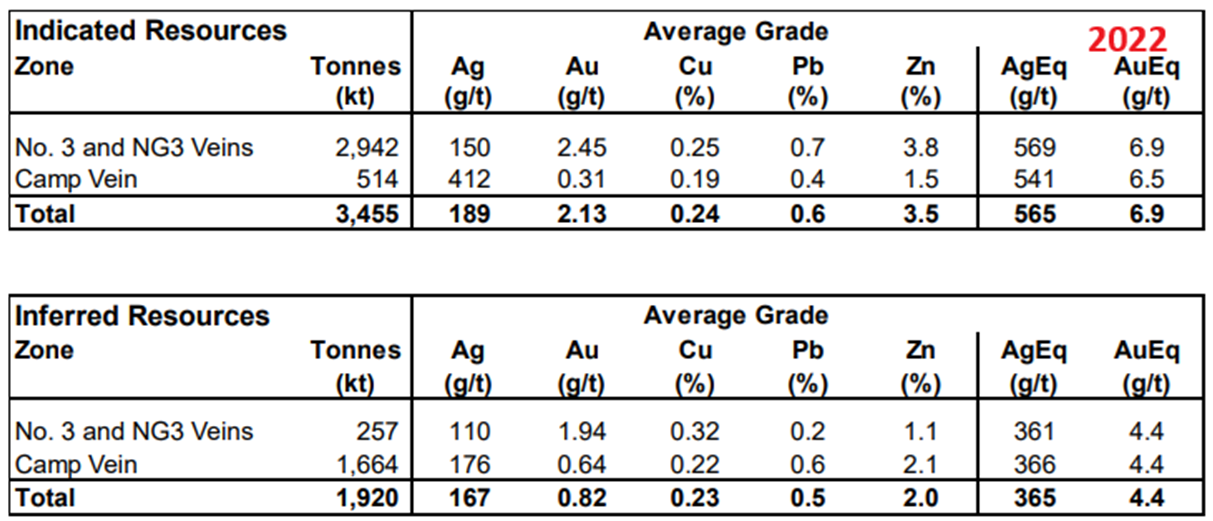
Two key elements are drawing attention here. The tonnage definitely increased, especially in the inferred resource category as the total tonnage more than doubled. Unfortunately, this coincided with a sharp decrease in the average grade of the resource due to the application of stricter dilution assessments as part of a stope optimization effort.
Additionally, keep in mind the 2026 resource update used a C$122/t NSR value to determine the cutoff grade, while the 2022 resource pegged that number at C$100. As such, a 22% increase in the required (dollar value of the) cutoff grade has already been put in place versus the 2022 update.
We also ran the numbers to calculate the net recoverable rock value per tonne based on the 2022 grades and recovery rates, applying commodity prices that were deemed ‘acceptable’ for 2022-2023 with $25 silver and $2000 gold. This results in the following calculation (again, before taking payability percentages into account). We also updated the FX to represent the slightly stronger Canadian Dollar back in 2022. This results in the following table for the 2022 indicated resource estimate:
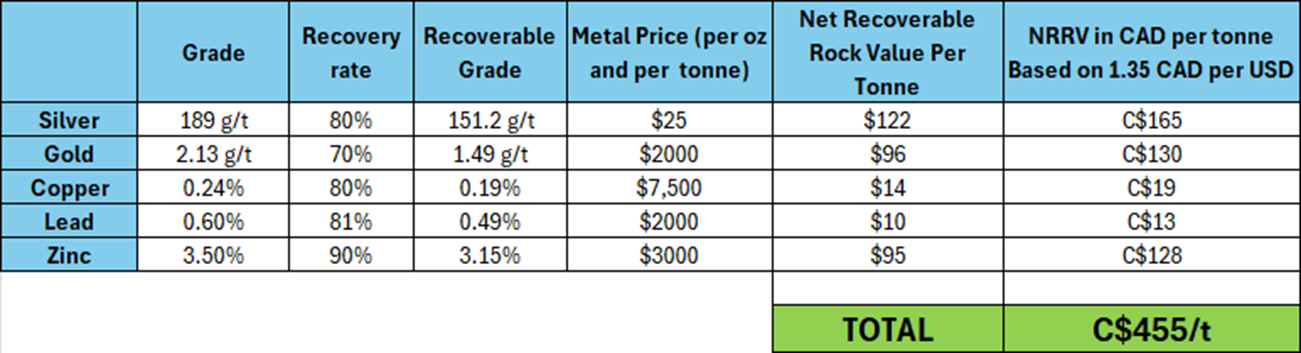
While this backward-looking exercise has no impact on the current situation, the higher commodity prices are saving the day here and based on all the calculations above, the margins based on a net recoverable rock value per tonne have increased in the 2026 resource update, notwithstanding the lower gold recovery rates and the 22% increase in NSR cutoff value.
This is a good example of why ‘equivalent ounces’ are not always the most reliable unit
One of the main reasons for the disappointing resource update is the use of the silver-equivalent ounces. A high silver price is great for the economics of a project, but when most other metal prices remain relatively flat, you need a higher amount of those metals to have one silver-equivalent ounce. Additionally, the average recovery rate used for gold in the 2026 resource is just 55%, down from the 70% used in the 2022 resource. This means that the total amount of recoverable ounces of gold as per the updated data is 115,500 ounces in the indicated category and 64,300 ounces in the inferred category. That’s a substantial decrease compared to the 166,000 ounces and 35,000 ounces of gold in the indicated and inferred resource in the 2022 resource category.
Despite adding more ounces to the global resource, the total amount of recoverable ounces of gold in the indicated resource has decreased by approximately 50,000 ounces. This alone already represents a negative impact of 4-5 million ounces on the silver-equivalent calculation.
However, discussions with management indicated more work is being done on gold recoveries as the decrease in the recent resource update is related to the exclusion of gold values in a pyrite concentrate where more work is needed to determine better recoveries and payabilities. As mentioned above, lifting the recovery rate back to the 70% level used in 2022 would add about 20,000 net recoverable ounces to the indicated and inferred resource category. And at the current gold price, this represents about C$125M in additional NSR value. We will be keeping an eye on these recovery rates as it is one of the ‘easiest’ ways to add value.
While it’s easy to blame the silver-equivalent calculation, even if we isolate the pure silver numbers, adding just about 7 million ounces (predominantly in the inferred resource category) is disappointing as well.
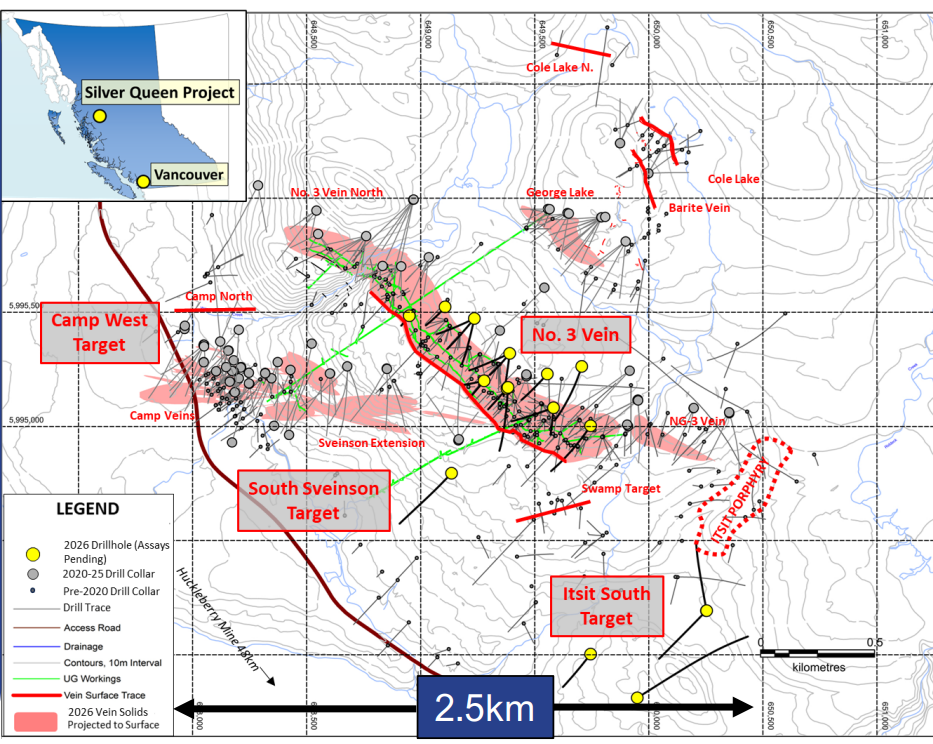
As you are likely aware by now, the higher silver price isn’t the only culprit here. In the resource update, the independent consultant used the Reasonable Prospects for Eventual Economic Extraction method (here after ‘RPEEE’). A more strict approach to define potentially mineable tonnes and mining widths, and as Equity Metals’ Silver Queen project is a narrow vein underground project, it is hit extra hard by this approach. It is interesting to see the RPEEE method is now already being applied in resource calculations, as this step was usually reserved for the engineering phase of the mine planning (as part of an economic assessment). This further adds to the reliability and trustworthiness of the resource model, but it also means a rather strict grade and dilution control application.
The result is a resource that’s smaller than anticipated, but should be more reliable and realistic than before as the 2026 update works with the anticipated diluted grades versus the undiluted grades in the 2022 resource. The direct consequence is that a higher dilution rate is applied to the inferred resource category, which weighs on the average grade, as indicated earlier in this update. The basic explanation is pretty straightforward: some of the previously defined mineralization ‘falls away’ as it becomes too diluted to make the required cut-off grade. Consequently, the average grade of the resource drops as a result of the added internal dilution. The new diluted grades reflect more what a mill would see during the mining process (and this is why the RPEEE approach was mainly used during the mine planning phase rather than a resource definition phase).
The balance sheet
Fortunately Equity Metals struck while the iron was hot, and the company raised money at opportune times to keep the treasury in a healthy shape. At the end of May (Equity Metals’ financial years end in August, but the full-year financials are not available yet), the company had a positive working capital position of approximately C$6.3M, and held just under C$7.4M in cash.
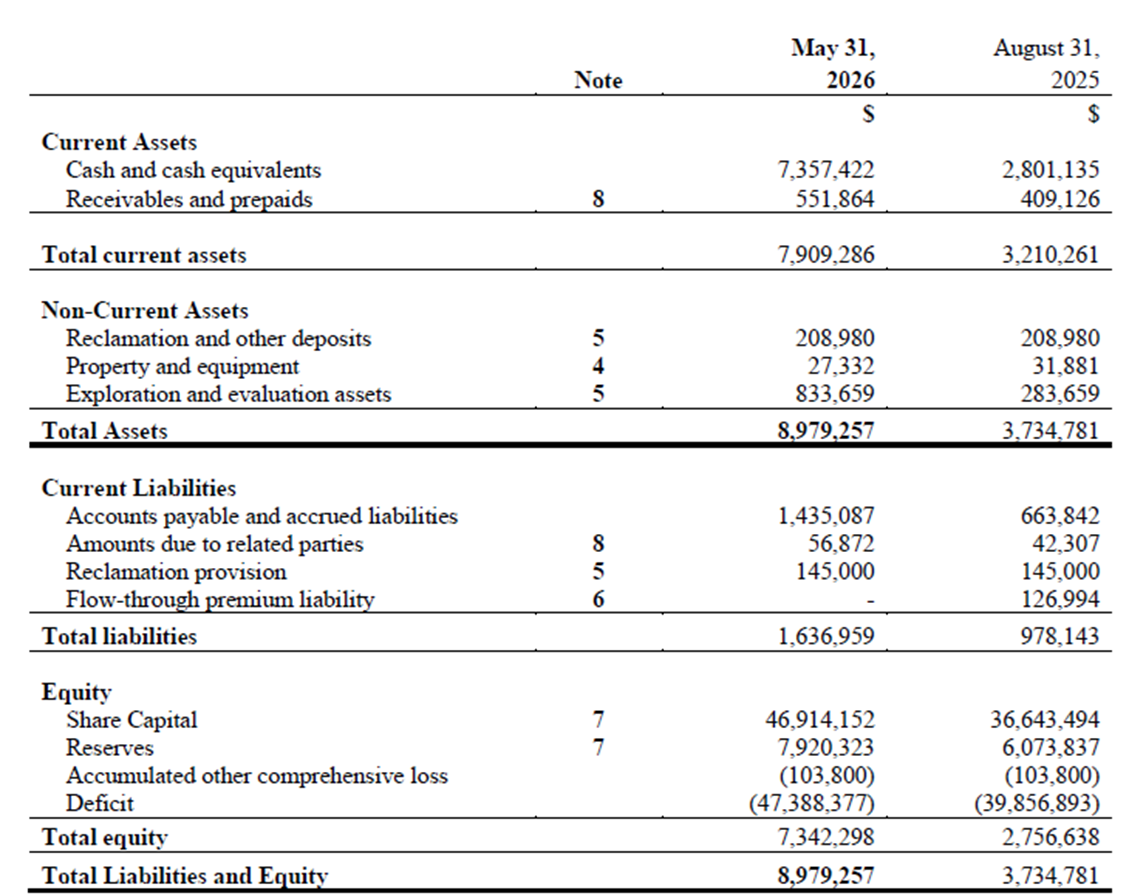
While we can expect the cash position to have come down a bit due to incurring four additional months of working capital needs and having spent money on consultants to put the updated resource together, we expect Equity Metals to still have approximately C$4-5M in cash and close to C$1M in flow-through funds (that will be spent before the end of this year)
While we have no updated information as of now, it will also be interesting to see in the year-end financials if all 2.02 million C$0.20 warrants that were slated to expire in August 2026 were exercised (for net proceeds of C$0.4M). Additionally, it would be interesting to know if any of the other warrants were exercised. It goes without saying any warrant exercise would have resulted in a welcome addition to the cash position, considering the current share price.
Conclusion
Equity Metals may just have had the bad luck to be the first company with a polymetallic deposit publishing a resource update in the current high silver price climate. ‘Pure’ silver exploration companies won’t be hurt as hard, but the higher the percentage of other non-silver content in the metals mix, the bigger the headwind these days. High silver prices are great for the economics of a project, but can be a pain when a silver-equivalent grade has to be calculated.
Equity Metals is the first, but certainly won’t be the last company that will have to deal with this.
The positive aspect of the Equity Metals resource is that the current resource is more detailed and more reliable than the 2022 resource given the application of the Reasonable Prospects for Eventual Economic Extraction model for the updated resource. But that’s just a consolation prize as the market had clearly set its sights on a resource expansion.
We understand the market’s reaction as expectations (including ours) were higher. Fortunately the company tapped the market when it raised C$4.6M in flow-through funds in Q4 2025, which helped to fund the additional exploration efforts.
We estimate the company currently has C$4-5M in cash on the balance sheet and fortunately that will be sufficient to cover the working capital needs in the foreseeable future while Equity Metals’ management team figures out its next steps to advance the project and the company.
The next strategic decision that will have to be made is an important one; will Equity Metals keep on drilling to A) hopefully increase the resources and B) improve the quality of the ounces? Or will the company start working on a Preliminary Economic Assessment given the amount of work that has already been completed on the project? We would be in favor of the latter, as that would allow the company to quantify the value of the project given the high-grade nature of the project.
In any case, close to C$1M in flow-through dollars will have to be spent before the end of the year, and we are looking forward to seeing what Equity Metals plans to work on.
Disclosure: The author has a long position in Equity Metals. Equity Metals is a sponsor of the website. This post is for educational purposes only; be mindful investing in junior mining stocks is risky and you may lose your entire investment if things go wrong. Please read the disclaimer.