Shareholders of GoGold Resources (GGD.TO) haven’t had a lot of reasons to be happy this year. Yes, the company’s share price did increase in the second quarter on the back of a higher gold and silver price, but the share price increase was definitely underperforming the GDXJ-ETF, and actually fell back in May, before the top on the gold and silver markets.
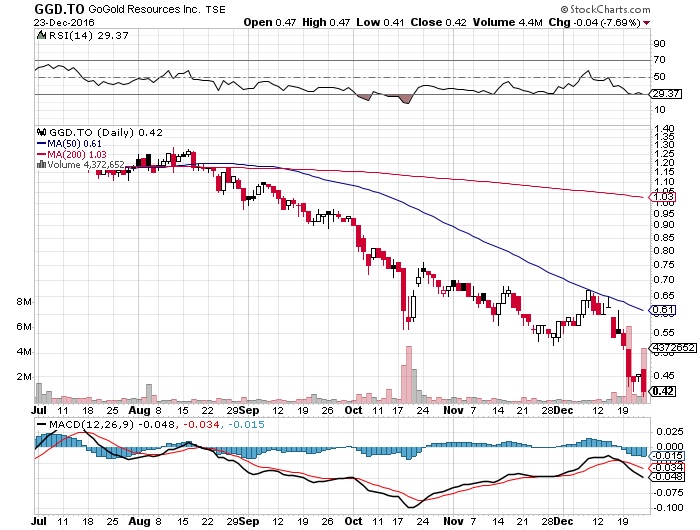
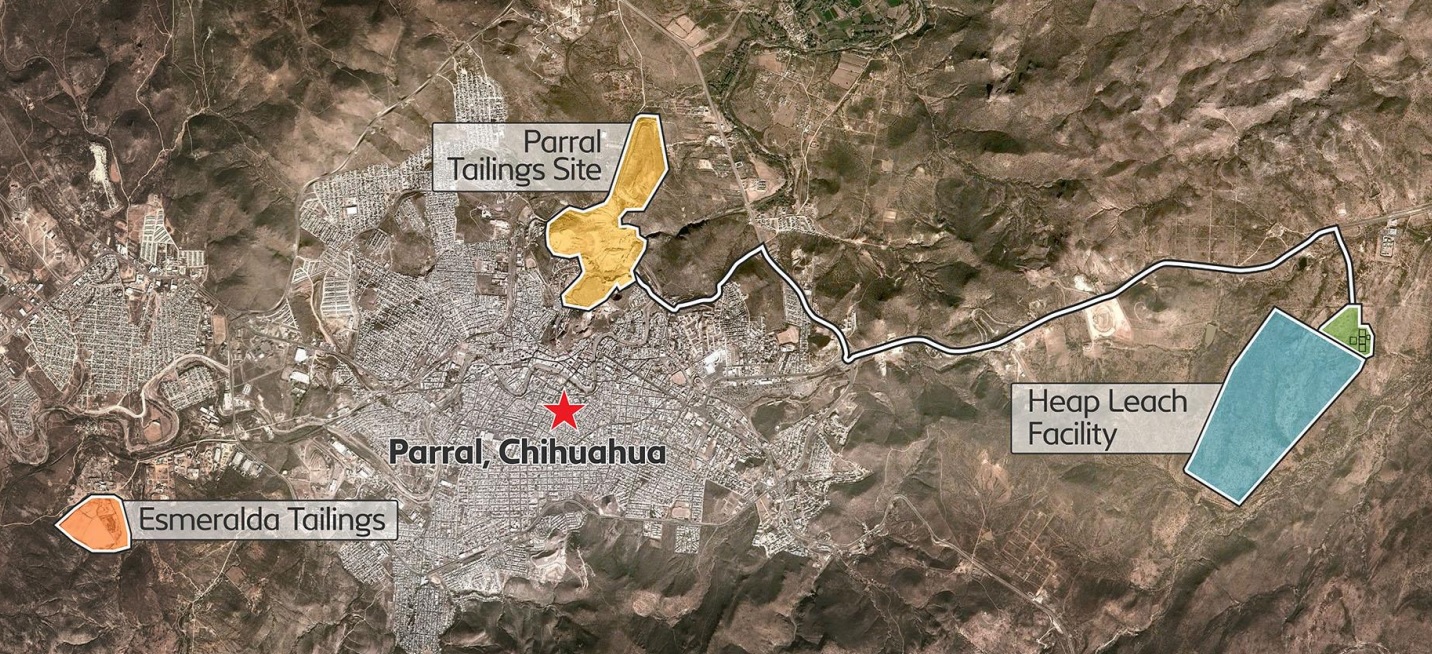
In fact, the year-to-date performance is probably the worst of all gold and silver producers. From C$1.16 on December 31 2015 to 42 cents last Friday is a decline of 64%, which is shocking considering both projects are supposed to be low-cost producers. Both the Parral tailings (silver) project and the Santa Gertrudis Gold project will produce at an all-in cost in the lowest quartile of all producers.
So why did the share price start to slide, and why did it continue to drop like a rock?
Well, let’s face it. FY 2016 was a non-event in terms of cash flow and production. GoGold produced less than 650,000 ounces of silver and 1.11 million silver-equivalent ounces (and less than 70,000 ounces in Q4), as its production rate was reduced due to its expansion plans and the rainy season. This should be a one-time event, and GoGold has confirmed it plans to produce 400,000-500,000 silver-equivalent ounces in Q1 FY 2017, which is the current quarter ending on December 31st.
This would indicate GoGold would already produce 40% of the FY 2016 production in just one quarter and this would put GoGold back on track although you should keep in mind de Q2-Q3 production rates might be impacted by the lower amount of ore stacked on the leach pads in Q4 FY 2016 (333,000 tonnes versus 631,000 tonnes in the previous quarter).
One of the main reasons of the ‘death spiral’ is GoGold’s deteriorating financial situation. Despite having raised C$11M in June, the cash position was once again really low at the end of September (US$2.1M).
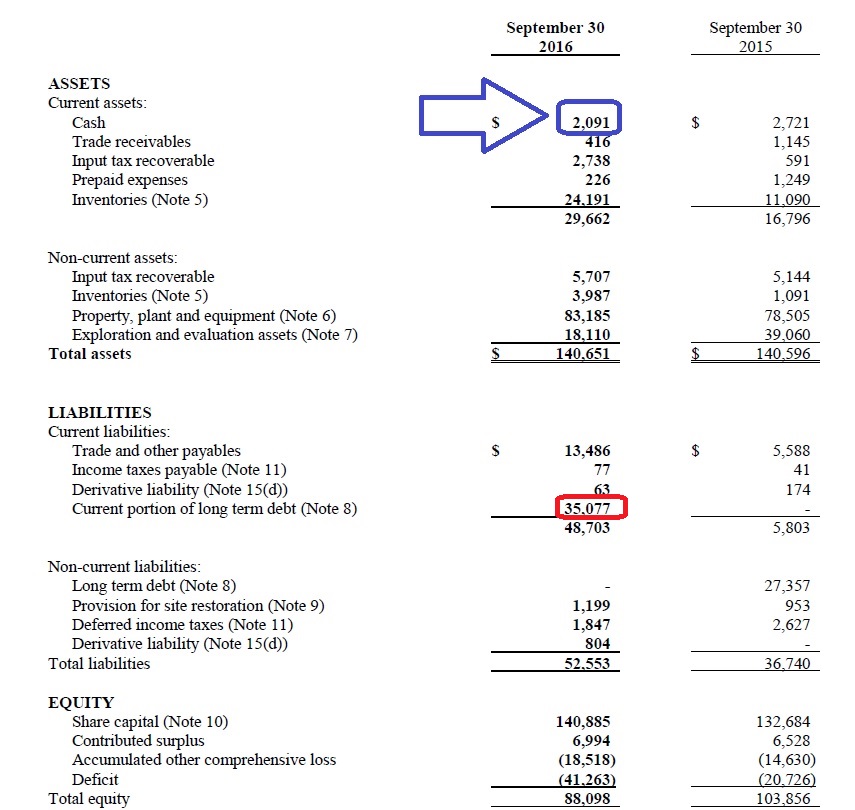
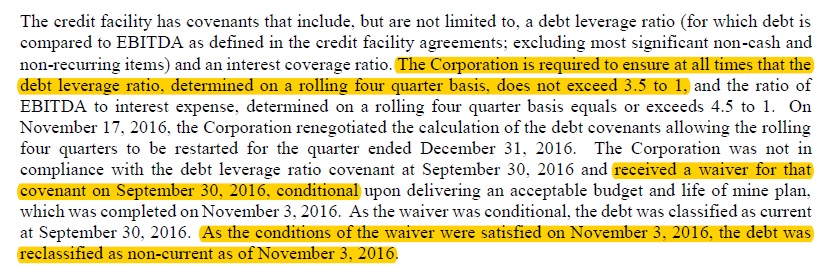
Perhaps even more worrisome for the market was the sudden requalification of the US$35M of debt on the credit line to a current liability (instead of a longer term liability given the credit line is just expiring in 2018). The requalification was due to GoGold breaching the covenants (the net debt / EBITDA ratio was in excess of 3.5), but as the conditions of a temporary waiver have been met, the debt is now re-classified as a non-current liability, which converts the working capital deficit once again in a positive working capital.
This doesn’t mean the company is out of the woods. It still has US$15M available under its credit line, but the direct capex of the Santa Gertrudis mine was estimated at $10M, to be spent in Q1 and Q2 of FY 2017. As GoGold has also started the mining activities at Santa Gertrudis, we wouldn’t be surprised to see the credit line being maxed out by the end of Q2.
That’s why it’s absolutely imperative for GoGold to have a good Q1 as this should allow GGD to add some cash to its balance sheet.
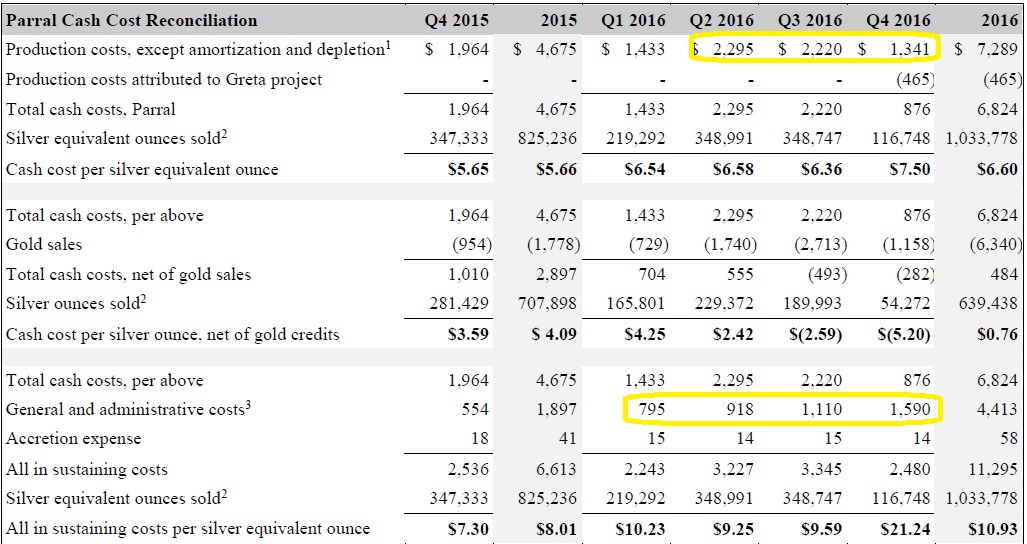
But how much free cash flow will GoGold generate? Let’s run some numbers. The run-rate of the operating expenses at Parral was US$2.2M per quarter. This could increase slightly due to (hopefully) higher stacking levels, but the depreciation of the Mexican Peso will have a positive effect on the local operating expenses. As the run-rate of the G&A expenses is $1.3M, the all-in costs for the silver at Parral will be approximately $3.5M in Q1 FY 2017.
If we would now use the mid-point of the official production guidance, 450,000 silver-equivalent ounces, the all-in cost per AgEq ounce would be approximately $7.80. At an average silver price of $16/oz, GoGold’s Parral project should be able to generate almost US$3.5M in free cash flow in the current quarter, assuming no taxes will be payable in the quarter. Throw in the expected US$3M in tax reimbursements, and GoGold should be able to improve its cash position.
The situation will remain very tight unless GoGold slows down the development of Santa Gertrudis (to spread the $10M capex over three quarters instead of two), but GGD has a chance to complete its investments without having to go back to the market (but will very likely max out its credit line). There’s one side note though; considering the EBITDA is so important to calculate the maximal leverage, it would be nice if GoGold would also start to publish its EBITDA result on a quarterly basis (as we were unable to immediately identify the EBITDA in the previous quarters or FY 2016).
We are looking forward to see the effective production results of the first quarter, and the guidance for Q2, as these will be decisive for GoGold’s plans and expectations. At 42 cents per share, the risk/reward ratio is definitely much better than it was just a few months ago!
Go to GoGold’s website
The author has a long position in GoGold Resources and plans to add to this position today (Wednesday). Please read the disclaimer
